Improving EPA's AirNow Air Quality Index Maps with NASA Satellite Data
Clients
U.S. Environmental Protection Agency (EPA)
National Aeronautics and Space Administration (NASA)
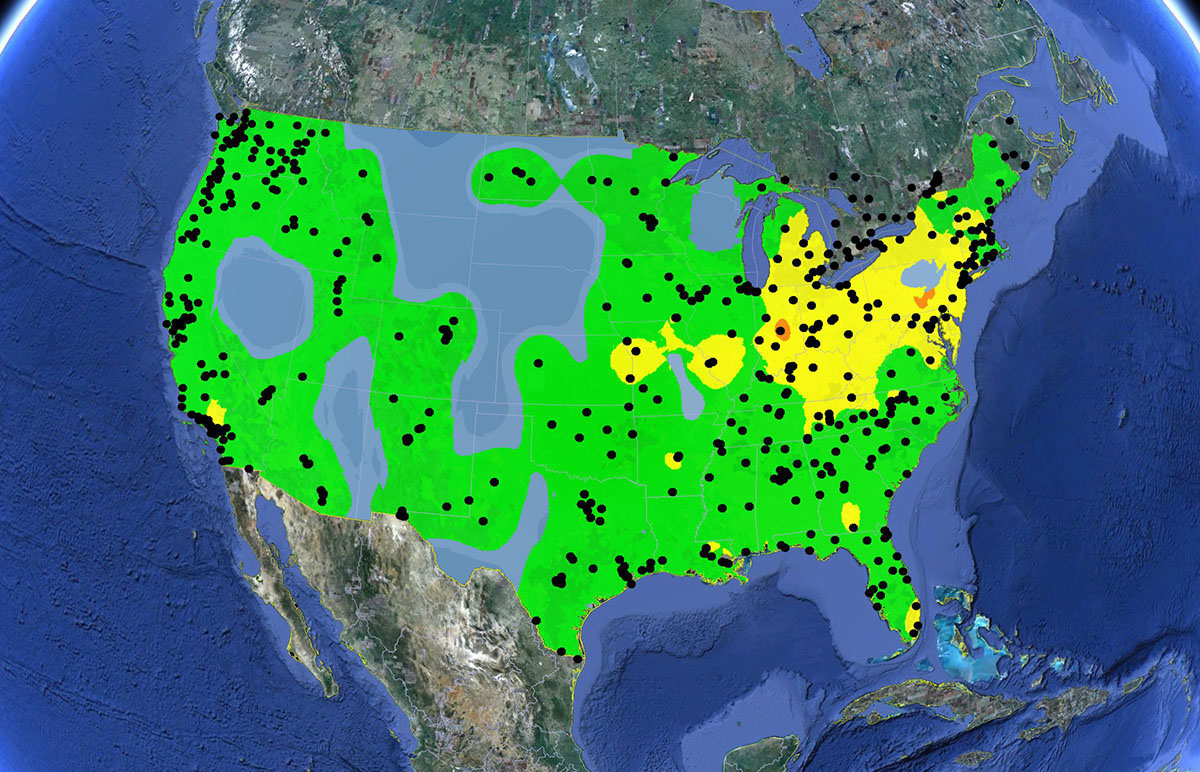
In conjunction with our partners, Sonoma Technology developed the <a href="https://asdp.airnowtech.org/" target="_blank">AirNow Satellite Data Processor (ASDP)</a href>, a suite of programs in the AirNow Information Management System. The ASDP fuses NASA satellite-estimated surface PM<sub>2.5</sub> concentrations with ground-based PM<sub>2.5</sub> measurements to create new, contoured Air Quality Index (AQI) maps. The new AQI maps provide enhanced air pollutant information in regions where monitoring is sparse.</p>
EPA’s <a href="https://www.airnow.gov/" target="_blank">AirNow program</a href> provides the public with easy access to national ambient air quality information using a health effects based scale (the AQI). AirNow presents real-time hourly AQI conditions and daily AQI forecasts by interpolating AQI levels to a grid and creating maps that cover national, regional, and local spatial scales. However, significant gaps in the coverage of ground-based PM<sub>2.5</sub>, ozone, and NO<sub>2</sub> monitors prevent complete nationwide mapping of pollutant concentrations in the United States. When interpolated and contoured, AQI levels in regions far from monitors may have higher uncertainty.</p>
This work
<ul><li>Creates a method for fusing data sets from different sources that is applicable to other types of data and can be used internationally.</li>
<li>Provides air quality information in regions without monitors and enhances the air quality information in regions with monitors.</li>
<li>Provides additional air quality information for air quality forecasters and decision makers.</li></ul>
Air Quality
Data Management
Data Visualization
Emissions
Exposure
Measurements
Modeling
Public Outreach
Software Development


Clinton P. MacDonald

Clinton
P.
MacDonald
President / Chief Scientist
Clint@sonomatech.com
/sites/default/files/2023-02/CPMres.pdf
